Tradra
Market Intelligence Platform
A market intelligence platform designed to make stock research simpler and more accessible. Tradra combines live market data, watchlists, stock comparison, and AI-generated insights into a single interface. The goal was to create a tool that gives everyday investors the information they need without the complexity of professional trading software.
Overview
The Problem
Most investing tools sit at one of two extremes.
Consumer apps often provide only the basics, making it difficult to dig deeper into a company before making a decision. Professional platforms, on the other hand, offer an enormous amount of data but are designed for institutions and experienced analysts. They can be expensive, difficult to learn, and overwhelming for someone who simply wants to research a stock.
I wanted to build something between those two experiences.
What Tradra Is
Tradra is a web-based market intelligence platform built for people who want to understand the market without needing institutional software.
Rather than trying to become another brokerage or trading platform, Tradra focuses on research. It helps users find companies, follow the stocks they care about, compare businesses side by side, and understand key differences through AI-generated summaries.
Instead of filling the interface with dozens of features, I chose to focus on the workflows investors perform most often and make those experiences feel fast and intuitive.
The free tier includes the complete core experience, while Tradra Pro expands on it with additional comparison slots, alerts, and deeper historical analysis instead of restricting essential functionality.
Features
Tradra is built around six core features. Each one supports a specific part of the research process.
Global Search
Users can search by company name or ticker symbol and receive normalized results across equities, ETFs, and indices. Search is debounced, fully keyboard accessible, and remembers recently viewed symbols to make repeated lookups faster.
Quotes & Fundamentals
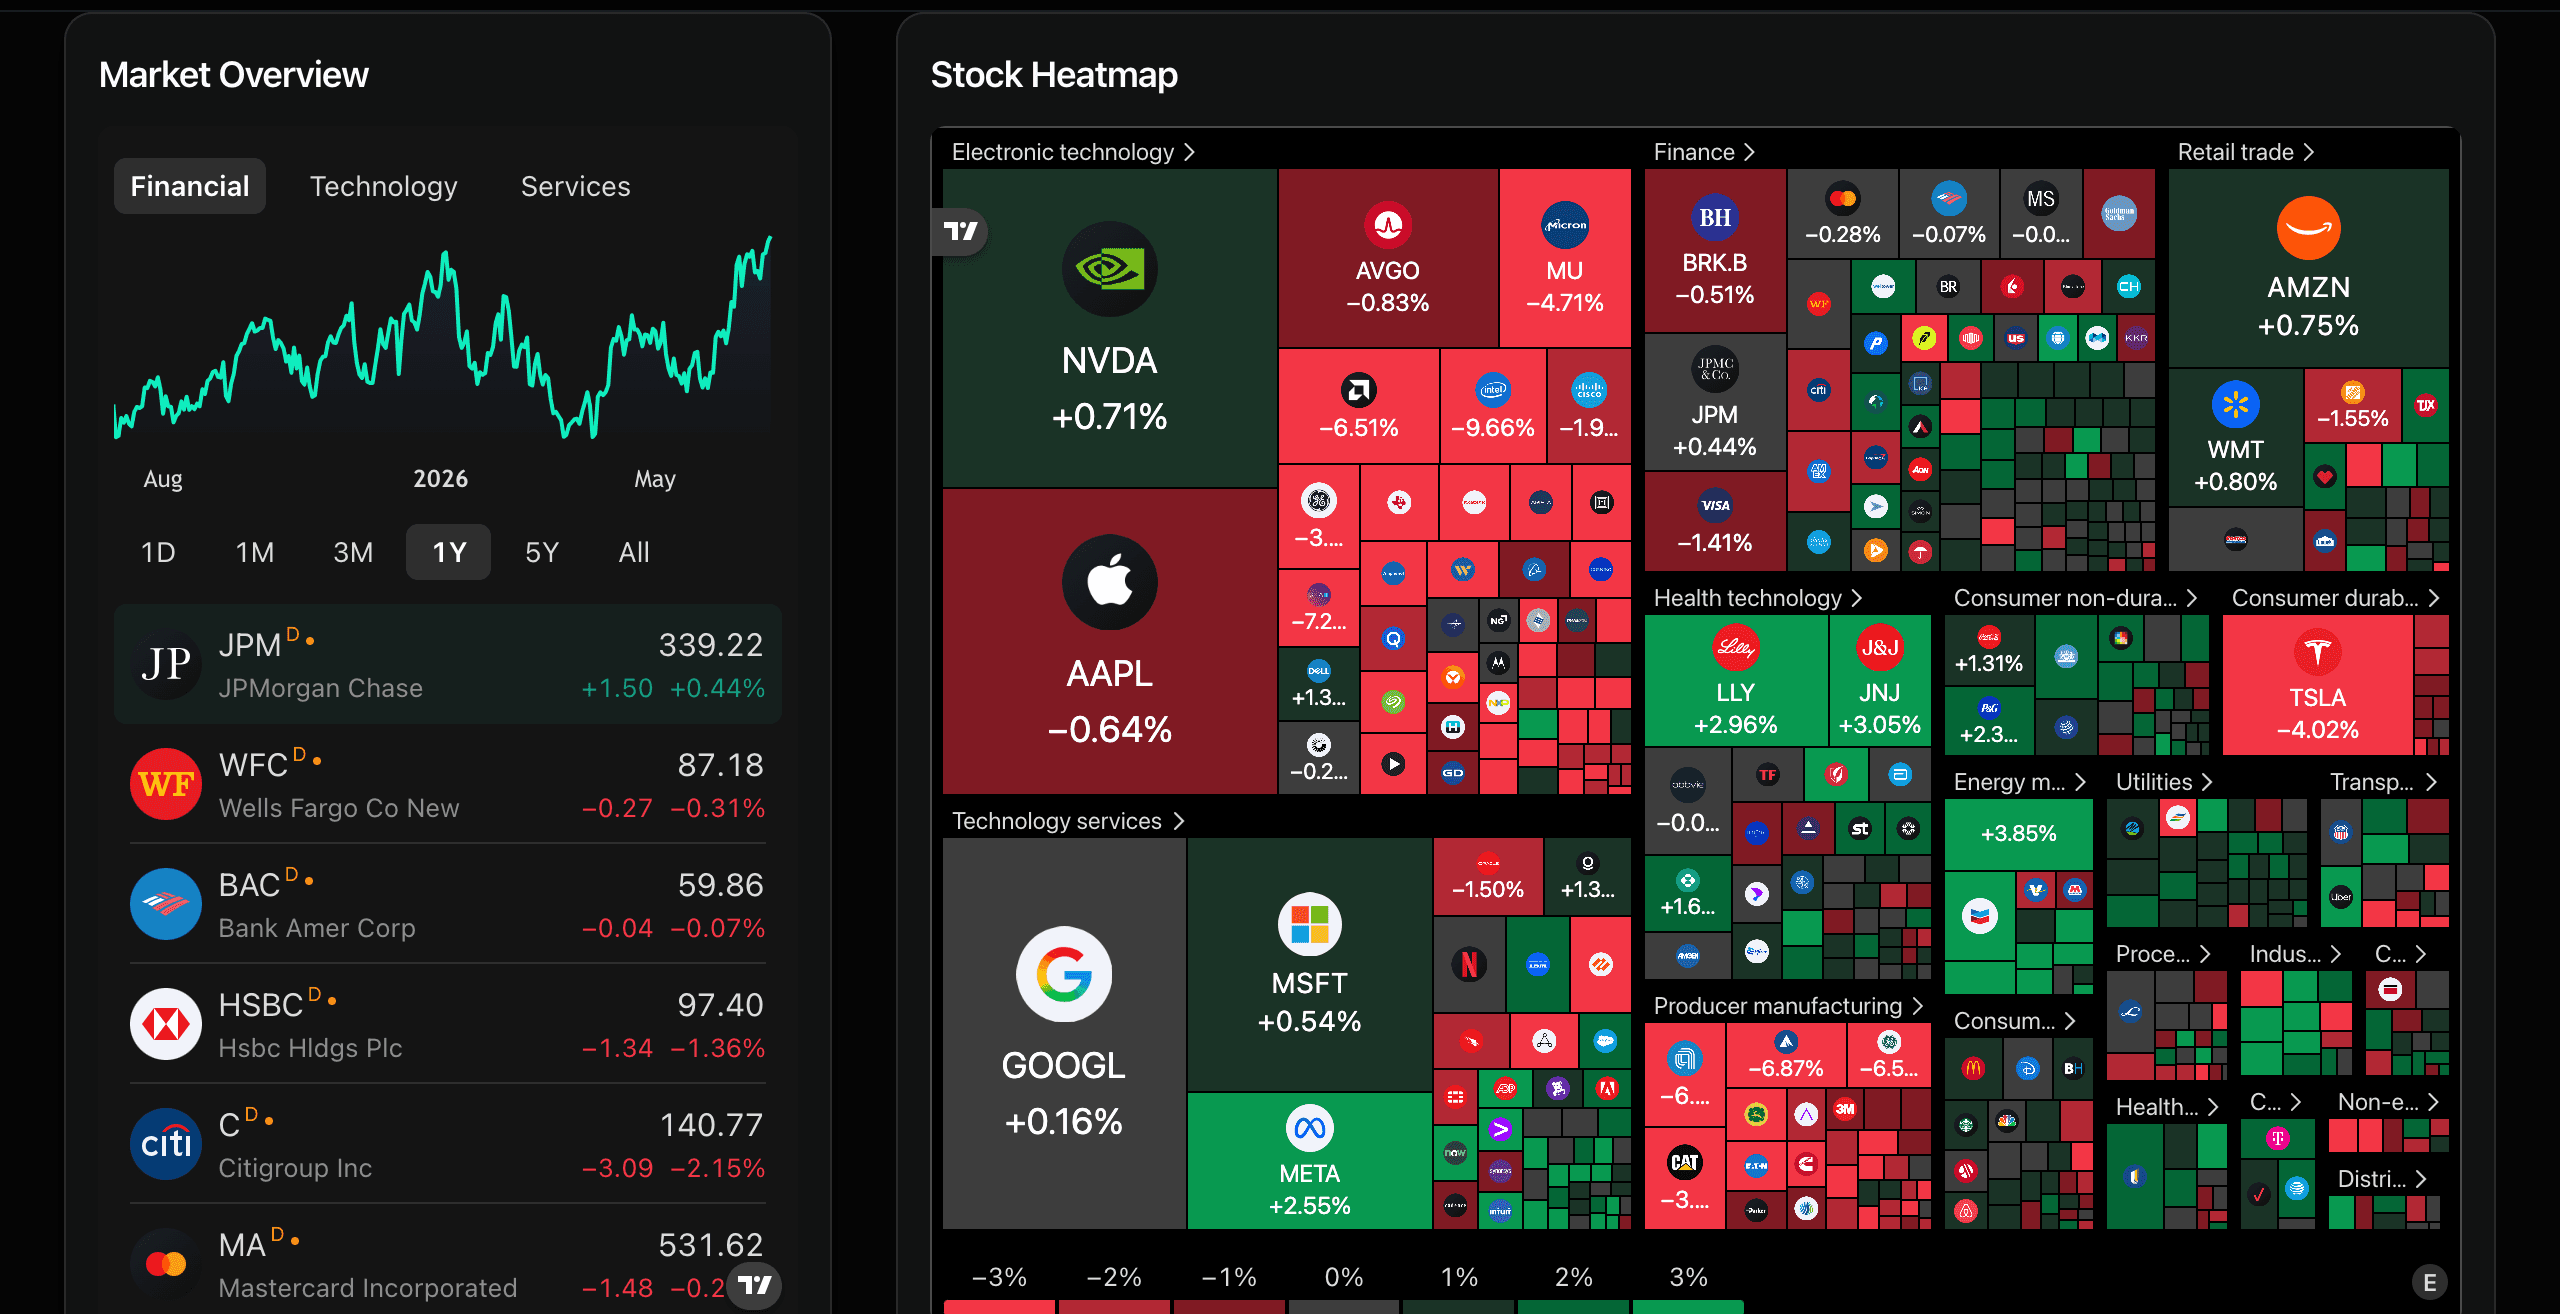
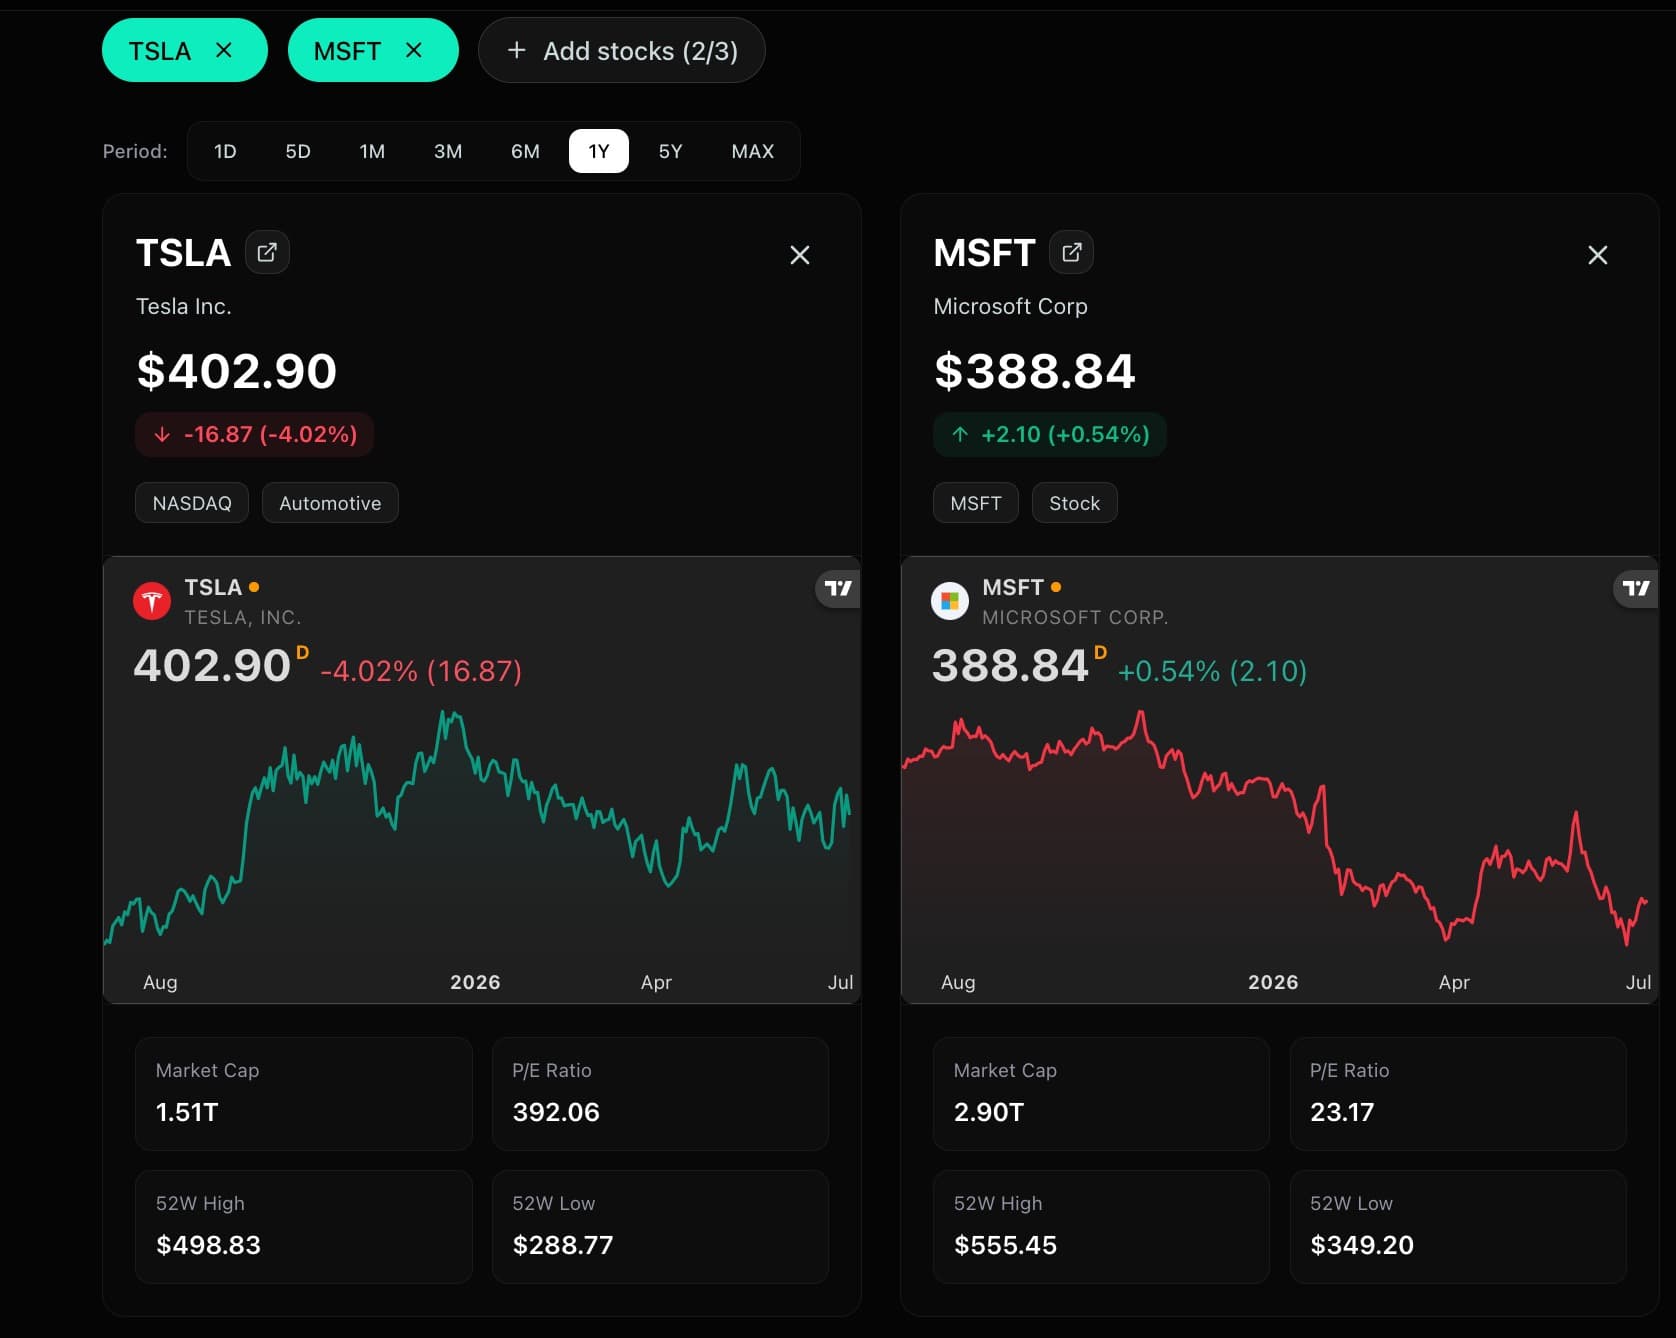
Every stock page combines live pricing with the financial metrics investors usually check first, including market capitalization, sector, P/E ratio, daily range, and other key fundamentals. The layout is intentionally compact so important information can be scanned quickly without feeling crowded.
Historical Charts
Historical price data is displayed through TradingView, allowing users to explore multiple timeframes from one day to five years. Using TradingView provides a familiar charting experience while allowing development effort to stay focused on the product itself rather than rebuilding charting functionality.
Personal Watchlist
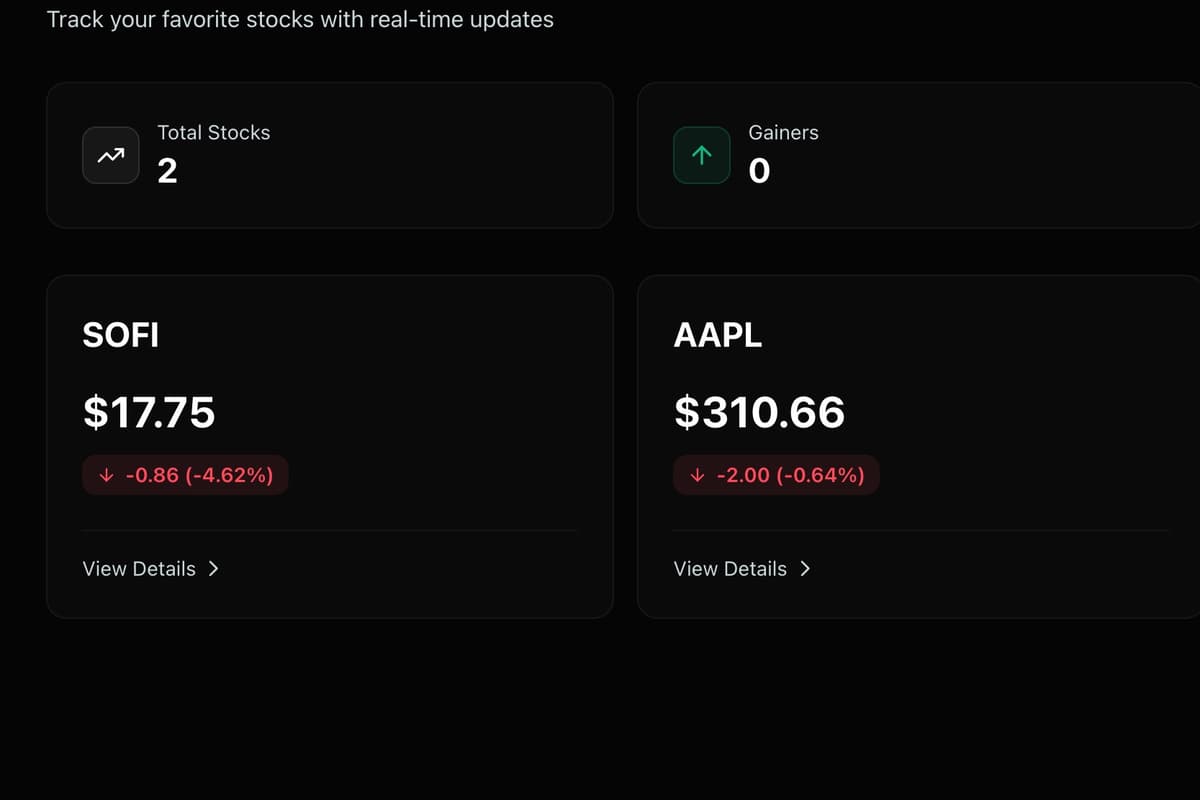
Users can build a watchlist that stays synchronized across devices and sessions. Prices update automatically in the background, while the interface keeps each row concise enough to quickly review movement across multiple companies.
Stock Comparison
Tradra allows users to compare up to three companies side by side. Financial metrics are aligned across consistent rows so differences between companies can be understood at a glance instead of switching between multiple pages. This became one of the core workflows throughout the application.
AI Insights
After selecting companies to compare, users can generate a short AI summary of the available data. Rather than recommending whether to buy or sell a stock, the AI highlights notable differences, explains relationships between the available metrics, and provides additional context that may not be immediately obvious from the numbers alone.
Keeping the AI descriptive instead of prescriptive was an intentional product decision from the beginning.
Core Concepts
Several ideas guided both the product design and technical architecture. Keeping these concepts consistent made it easier to add new features without changing how the application worked.
Architecture
The architecture behind Tradra was designed to stay simple, reliable, and easy to extend. Since I was building the project on my own, I leaned heavily on managed services and proven technologies instead of introducing unnecessary complexity.
Design Decisions
Finance applications often prioritize information over usability. Tradra tries to balance both by presenting a large amount of market data without making the interface feel overwhelming.
- Meaningful Use of Color. Green and red are reserved almost exclusively for price movement, making changes immediately recognizable. The rest of the UI relies on a neutral palette.
- Typography Based on Content. Financial figures use a monospace font for alignment. Long-form content uses a serif typeface to improve readability. Interface elements use a clean sans-serif font.
- Designed for Scanning. Watchlists and comparison tables were designed to display useful information compactly so users can compare companies without excessive scrolling.
- Clear Visual Hierarchy. Every page has one primary focus, keeping supporting controls intentionally understated.
User Flows
Tradra was designed around three core workflows. Most features exist to support one of these experiences.
Technical Challenges
Managing API Rate Limits
The homepage displays multiple indices alongside popular stocks. Server-side caching absorbs repeated requests before they reach the provider, while TanStack Query keeps recently viewed data available on the client.
Controlling AI Costs
AI responses are cached using both the selected companies and a snapshot of the underlying market data for a limited period. Repeated comparisons within that window reuse existing responses.
Creating a Real-Time Experience
Instead of maintaining continuous streaming connections, Tradra refreshes visible market data at regular intervals while pausing updates when a page is inactive. Small interface animations help users notice price changes organically.
Keeping Data Consistent
Because different providers can report slightly different prices, the quote panel acts as the application's primary source of truth. AI summaries are generated from this same payload.
Keeping AI Responses Reliable
The server constructs a structured payload using verified market data and instructs the model to explain only the information provided, intentionally preventing it from making investment recommendations.